This page will take you through the New Management Dashboard and how to customize the dashboard to your needs. Please read through the document to understand the steps to get the dashboard setup for users.
Opening the Management Dashboard
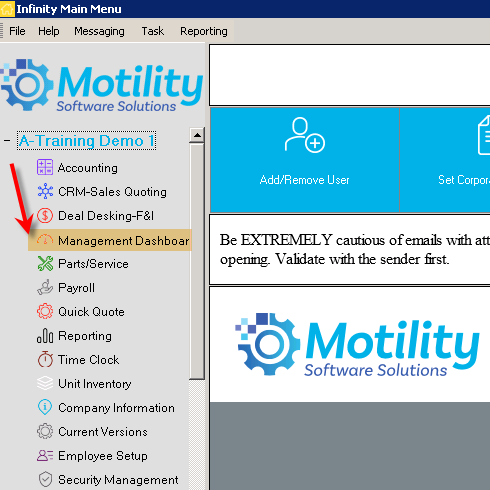
In the Motility Software main menu select the Management dashboard to launch the main screen.
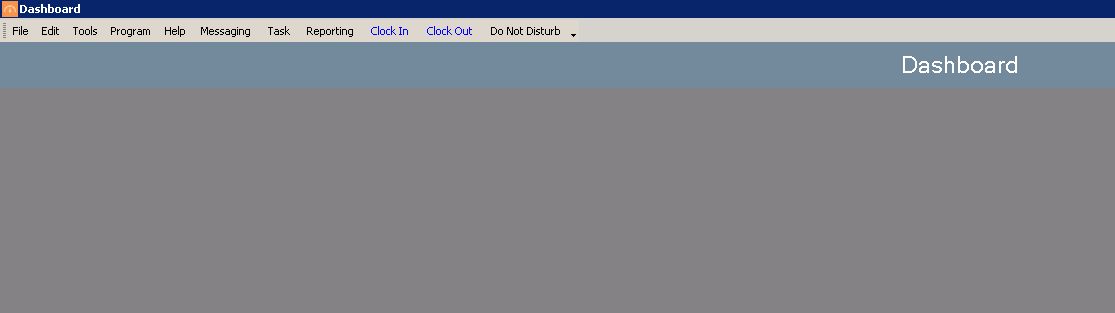
Once the Dashboard opens it will be blank by default until you set up your new tab or load an existing preset (will be explained as well)
Now we can create our new tabs and add KPI (Key Performance Indicator). First let’s see our MENU OPTIONS
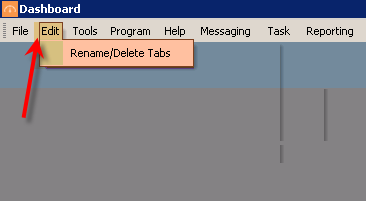
EDIT MENU>
Rename/Delete Tabs: This allows users to remove or rename a tab that has already been set up on a preset.
TOOLS MENU>
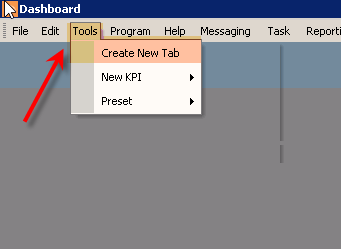
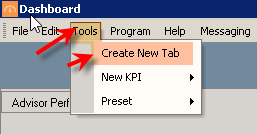
Create New Tab: This allows users to add a new tab to the current preset on the dashboard
(need to do this first to have your first tab to add KPIs)
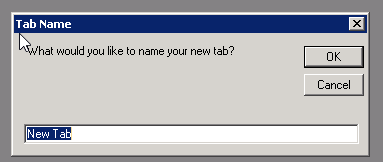
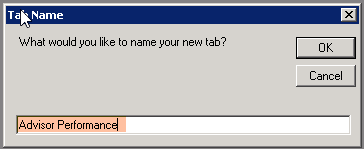
A pop up will allow you to name the new tab
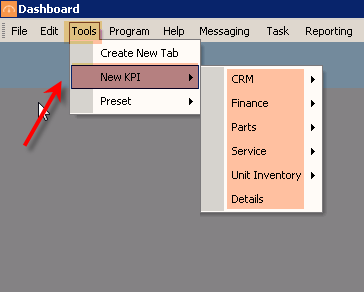
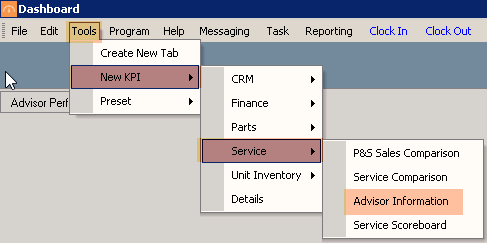
New KPI: Allows users to select which module and what data they want the dashboard to show on the screen (This will be covered in detail on the document)
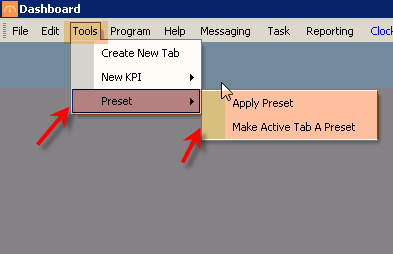
PRESET>
Apply Preset: Allows users to apply a preset that has been saved already and load that data on the dashboard.
Make Active Tab A Preset: Allows users to make the current dashboard they have open or have built a preset. Other users can now use that preset ( Ex. A GM will create a sales preset for the sales manager to use)
Creating a tab and Applying a KPI to the Dashboard
Create a New Tab:
Tools> Create New Tab> Name your New Tab
For this example, we will use Service
Applying a KPI
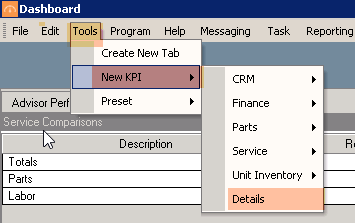
Go to Tools> New KPI> (Select Module)> (Select Data Field)
For this example, we will use Service
Applying the New KPI to the screen
Once you have selected the KPI you can now place it on where you would like to see the Data.
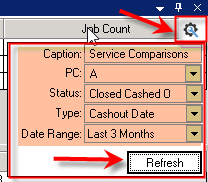
When you begin dragging the KPI, Arrow will appear on the screen to where you would like to place the KPI. Hover with your cursor with the KPI Selected to the arrow/area you would like to pin the KPI. Once Pinned, there will be a gear where you can select the data you want the KPI to pull. Once you select your fields hit the Refresh button for the data to appear. Users can use the same KPI multiple times to see data by location.
KPI once pinned to the dashboard:
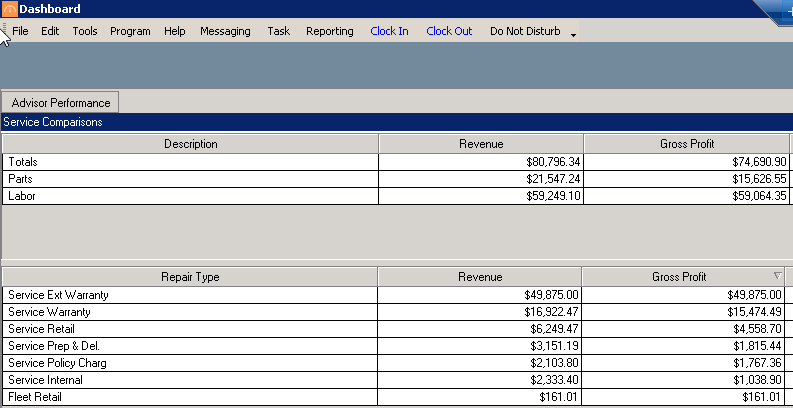
Users can also change the caption for the KPI to help identify them ( if doing multiple locations)
Also, for that KPI, you can AutoHide it (Typically used for details portion for KPI) and you can remove the KPI completely
Please Note Certain KPIs are very Large and may require their own TAB. How the screen layout is set is determined by the user but using multiple tabs can help a user understand the data better.
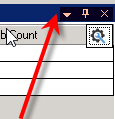
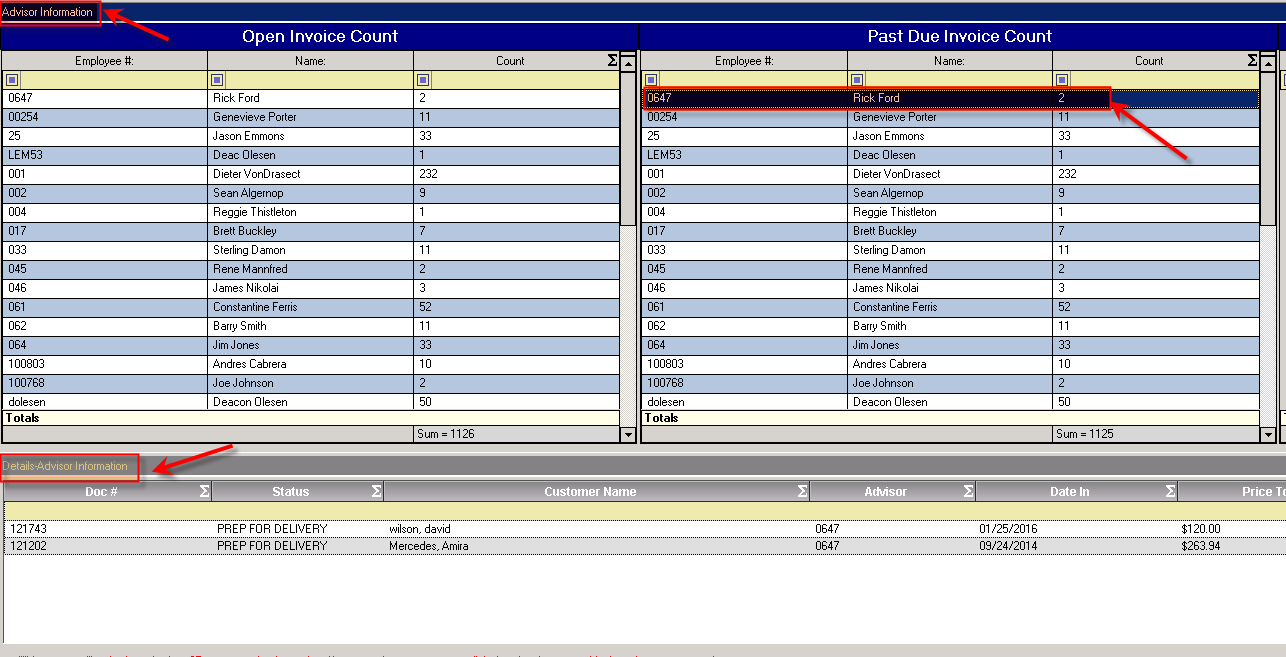
Details: Some KPI can use a “Details” option where you see the data per user but the dashboard can give you a break down of those number s as well. Not all KPI use the details so if you select details and no data appears that KPI does not have detail. If you auto hide a small tab will be in place where you pinned the details.
To Apply Details:
Go to Tools> New KPI> Details
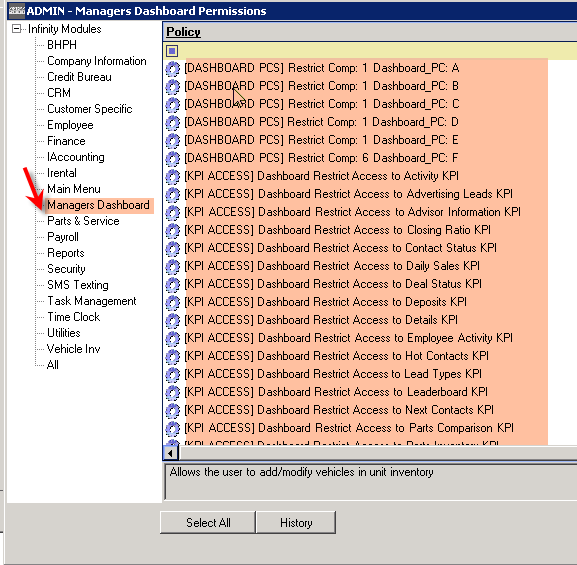
Permissions
There are permissions that have to be turned on in order to use the New Dashboard as well. You can restrict users from KPI for other departments as well as PC/Locations